
Displays

How to Analyze I2C Waveforms

I2C is the most commonly used communication protocol in CTP systems. When customers report touch issues, we often use an oscilloscope to verify whether the CTP is functioning properly. Understanding how to analyze I2C waveforms is therefore essential for problem diagnosis and effective technical communication with customers.

Background of I2C

I2C (Inter-Integrated Circuit) was originally developed by Philips in 1982 for communication between its internal chips. The original specification supported speeds up to 100 kHz with 7-bit addressing. Although 7-bit addressing allows up to 128 addresses, some are reserved, so only 112 valid device addresses can be used on a bus.

In 1992, the first public specification introduced 400 kHz Fast Mode and extended 10-bit addressing. In many systems (for example, Arduino-compatible boards using the ATmega328 microcontroller), I2C support typically remains at Standard Mode (100 kHz) or Fast Mode (400 kHz), with either 7-bit or 10-bit addressing. Higher-speed modes (1 MHz to 5 MHz) exist but are less common.

*Serial vs Parallel Communication

Serial communication (e.g., I2C, UART, SPI, USB) transmits one bit at a time over a single data line in time sequence.

Data for I2C is typically as:

Clock

1 0 1 1 0 0 1 0 // I2C will transmit these data one bit by one bit


Parallel communication (e.g., MCU parallel bus, RGB interface) transmits multiple bits simultaneously in one clock cycle.

Data for RGB is typically as:

D7 D6 D5 D4 D3 D2 D1 D0

1  0  1  1  0  0  1  0 // 8 bits are transmitted in one clock cycle.


I2C Bus Architecture

I2C supports multi-master and multi-slave configurations and operates in half-duplex mode.

Customers often mention the term “node.” A node refers to any device connected to the I2C bus that has a valid address and is capable of communication. A node can function as either a master or a slave device.

A slave device, such as our Touch IC, cannot initiate communication. It can only respond to requests from the master. The slave must recognize its own address and will respond only when the received address matches its configured address.

For example, assume three slave devices have addresses 0x1A, 0x2A, and 0x3A. When the master transmits 0x2A on the SDA line, the second slave compares the received address with its own. If the address matches, communication is established.

Although all slave devices can detect the address transmitted by the master, only the device with the matching address will respond by sending an ACK (0). The others will ignore the transaction (NACK = 1). Each device address must be unique and is typically determined by hardware configuration. Examples will be provided later.

Half-duplex means that data can flow in only one direction at a time — either from master to slave or from slave to master. The data direction is controlled by the R/W bit.

In the I2C bus, SCL is the clock line and is always generated by the master. SDA is the data line and uses an open-drain structure, meaning it can be pulled low by either the master or a slave device.


Open-Drain Structure

What is an open-drain (or open-collector) structure? This type of output driving method enables bidirectional communication on a single data line in I2C systems.

An open-drain output can actively pull the signal line low or remain in a high-impedance (Hi-Z) state, but it cannot actively drive the line high. In contrast, a push-pull output can actively drive the signal either high or low.

When multiple devices are connected in parallel on the same bus, push-pull outputs may cause signal conflicts or even short circuits if different devices attempt to drive the line to opposite logic levels at the same time.


Push-pull output uses complementary PMOS and NMOS transistors to determine whether the output drives a high level (VDD)  or a low level (ground).

High Level

Low Level

In an open-drain output structure, the PMOS transistor is permanently turned off (disconnected).

The circuit can either drive a low level (when the NMOS is turned on and conducts) or remain in a high-impedance state (when the NMOS is turned off).

Low Level

High-impedance state

When an external pull-up resistor is connected, the value of the pull-up resistor will appear at the output. PN-MOS itself are two diode2, with essentially infinite resistance.)

Open-Drain structure with a pull-up resistor


Only after understanding what open-drain outputs and pull-up resistors are can we better interpret the waveforms of SCL and SDA. In theory, SCL should be a regular square wave with very clean rising and falling edges.

In practice, for normal SCL and SDA waveforms, the falling edge is fast and sharp because the pull-down is active. The rising edge, however, is slower and curved or sloped because the voltage is pulled up through a resistor charging the line’s capacitance

As in the photo above, the yellow SCL line has a very slow rising edge, which is usually caused by a pull-up resistor that is too large.

Generally, for 100 kHz I²C, a 4.7 kΩ pull-up resistor is recommended, and for 400 kHz, 2.2 kΩ. If the pull-up resistor is too large, it can sometimes cause the touch sensor to become unresponsive.

A smaller pull-up resistor results in faster rising edges and stronger noise immunity, but it also increases power consumption.


I2C Data Format

Start and Stop Conditions

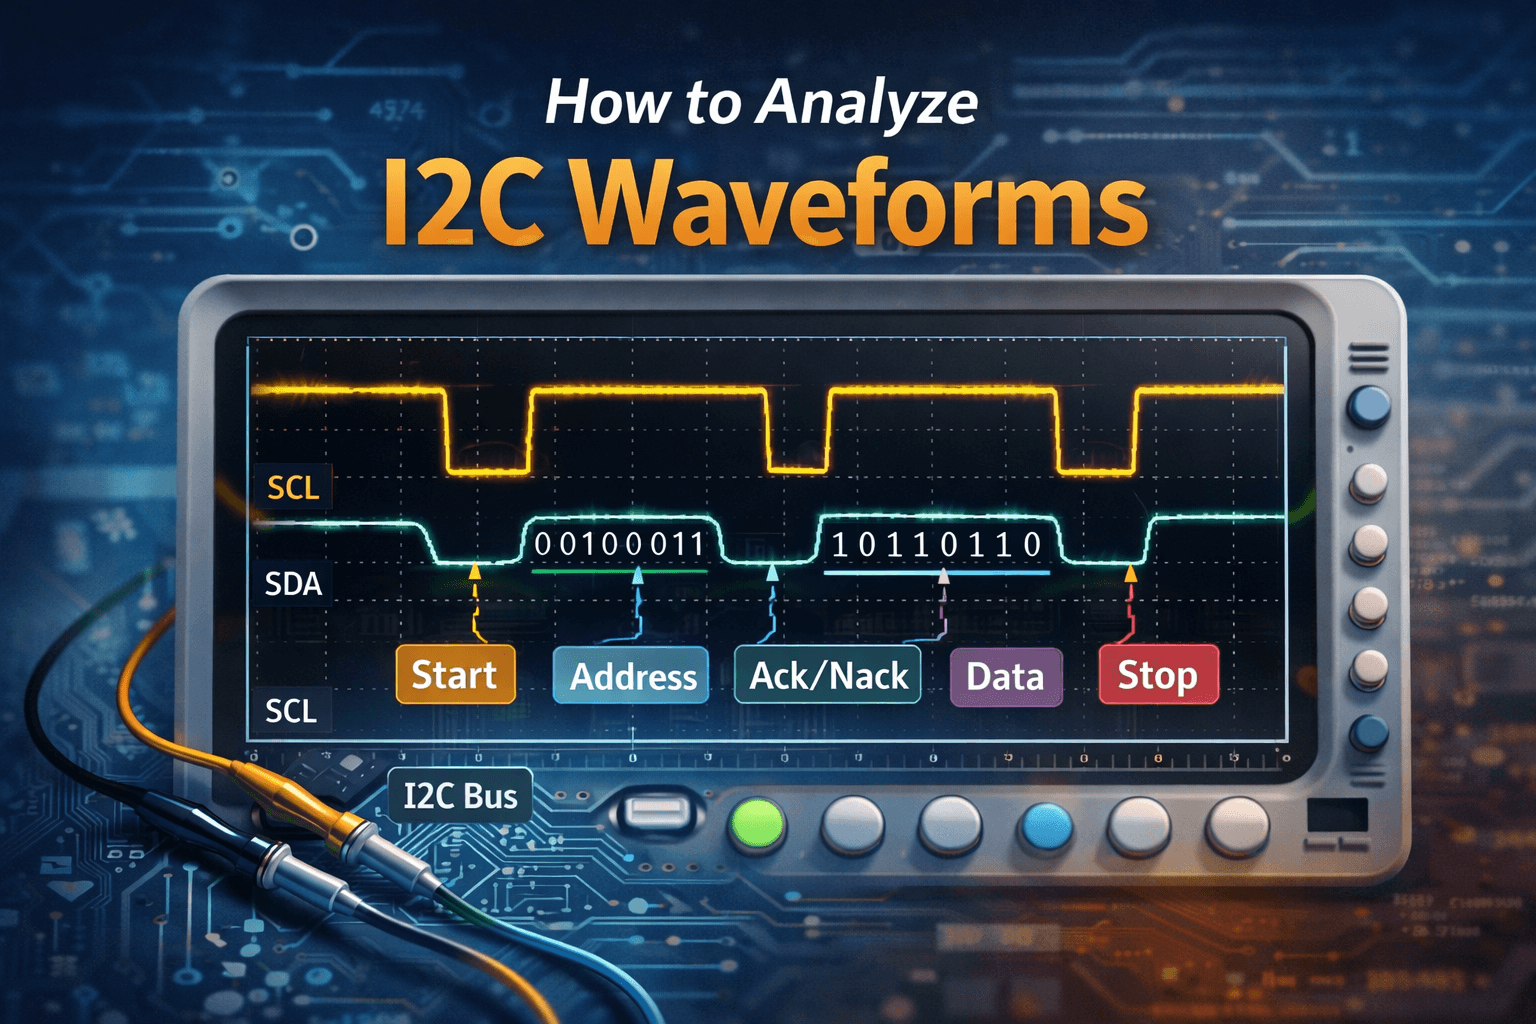
When SCL is high: SDA transitioning from high to low indicates a START condition; SDA transitioning from low to high indicates a STOP condition.

Addressing

An address frame typically consists of a 7-bit address plus 1 R/W bit (0 = write from master to slave, 1 = read from slave to master).

SDA must change only when SCL is low. During SCL high, SDA must remain stable because data is sampled during the high period of SCL.


In the diagram below, we can see that the slave’s A1, A2, and A3 pins are all connected to ground. This makes the address 1110000, which is 0x70 in hexadecimal.

Some devices, however, do not have A1, A2, and A3 address pins. In that case, the address cannot be changed and is fixed as a default internal static address.

ACK / NACK

After every 8 bits of data, the 9th clock cycle is used for ACK/NACK. The receiver drives SDA: ACK = 0 (acknowledge), NACK = 1 (not acknowledged).

A short pulse may appear between the 8th bit and the ACK bit. This occurs when the SDA line is released during direction switching. Because this transition happens while SCL is low and data is sampled during SCL high, this short pulse is not interpreted as valid data.


If you have any questions, please contact our engineering.

author-avatar

About Alex Wang

Orient Display - Technical Engineer

Displays

LCD Power-on Process

LCD Power-On Process

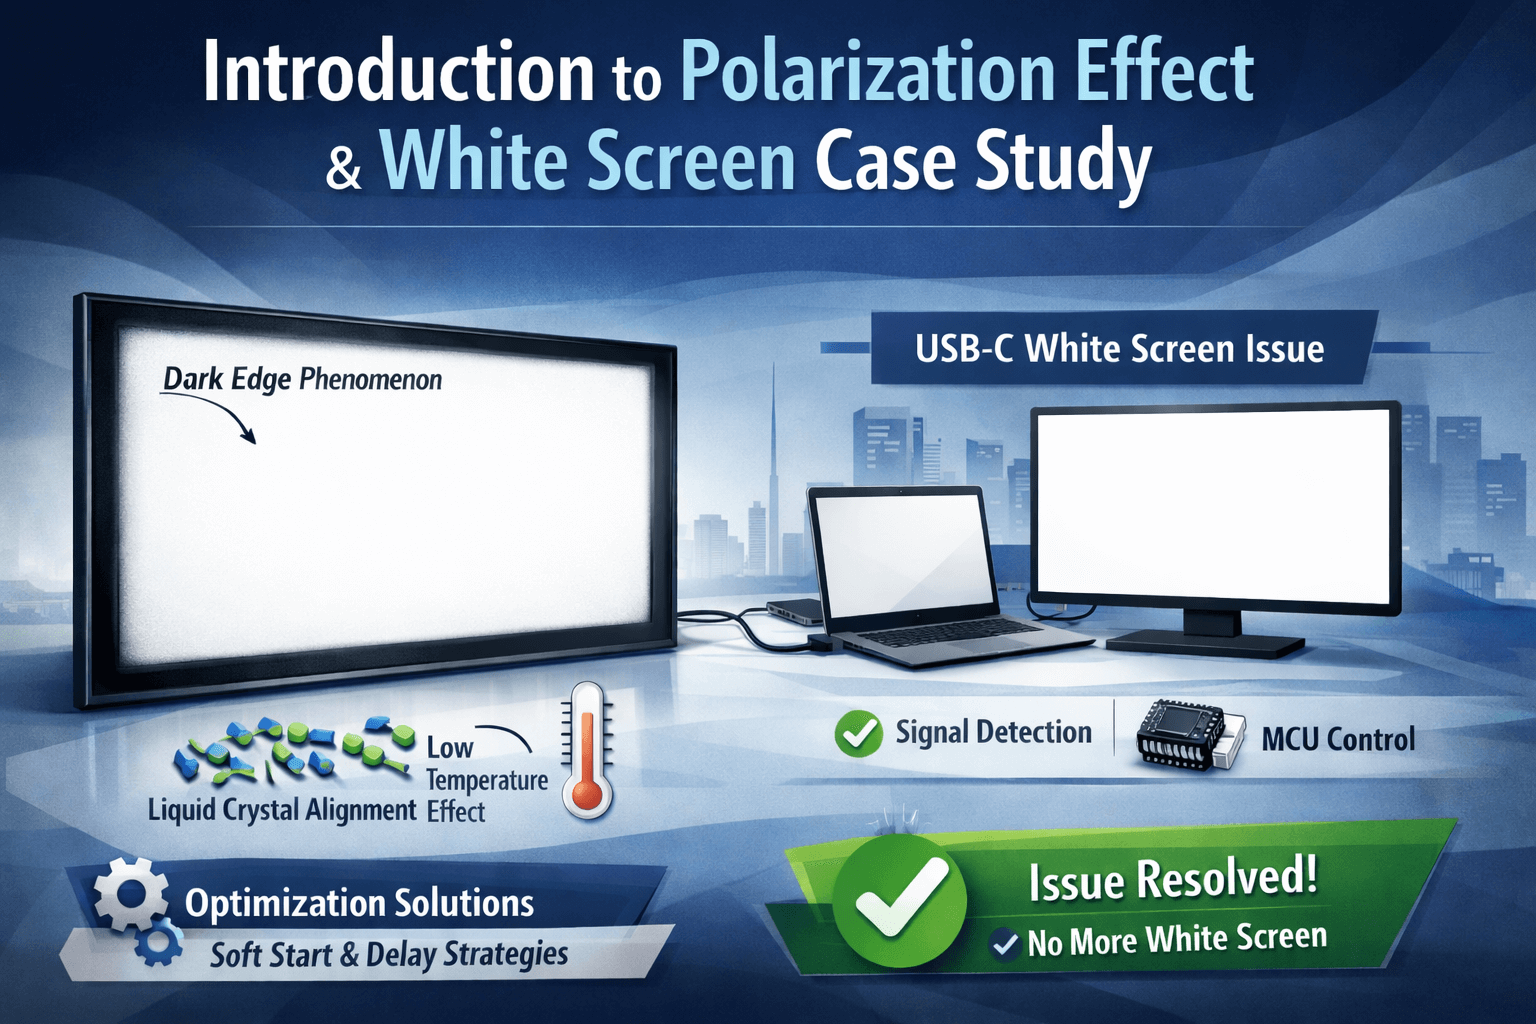
As LCD engineers, we often receive the following question: Why does a display occasionally show a white screen during power-on, while under other conditions it initializes and operates normally?

At first glance, it may appear that there is a problem with the display. However, in most cases, the issue is related to power sequencing and initialization timing. In other words, it is more of a software or system-level timing issue rather than a hardware defect.

To better understand this phenomenon, we need to review the LCD power-on process from a system-level perspective.

What Happens During Power-On?

A display contains a driver IC, internal logic circuits, voltage generation circuits, and timing detection circuits.

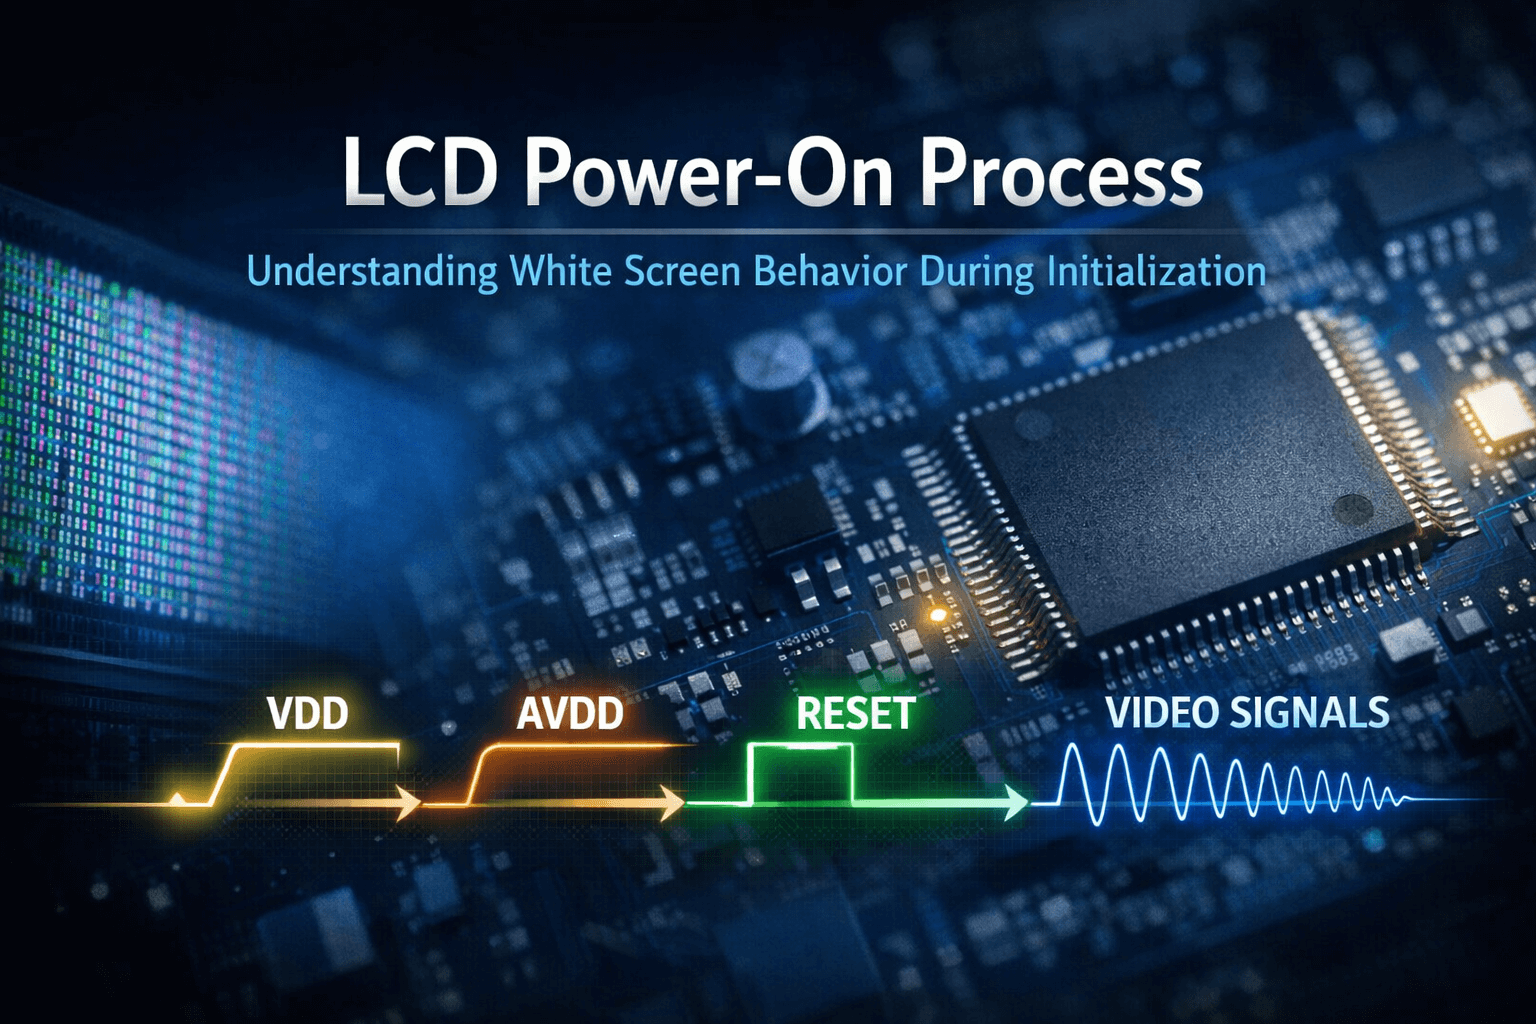
When the display is powered on, the following sequence must be strictly followed:

  1. The digital logic power supply (VDD) rises.
  2. The analog driving voltages (AVDD, VGH, VGL) are established.
  3. The RESET signal is applied and then released.
  4. The host MCU begins transmitting video signals, including clock, sync, and pixel data.

If any of these steps fail or occur out of sequence, the panel may not initialize correctly.

When a white screen is observed, it does not necessarily mean that the display is defective.

In most cases, it indicates that the TFT driver IC is not operating in its normal image refresh state.


Possible Root Causes of a White Screen

  1. The Source Driver Outputs a Default Voltage Level

Under normal operation, the driver IC converts digital pixel data into analog driving voltages. These voltages control the liquid crystal orientation, resulting in different light transmittance levels for each pixel.

If the driver IC has not completed initialization, has not detected valid timing signals, or has not received valid image data, it may enter a default output mode. In this mode, the output voltage typically corresponds to a fully open liquid crystal (LC) state, which results in a uniformly white screen.


  1. No Valid Image Data Is Latched

The driver IC requires continuous timing signals to correctly latch pixel data. These signals include:

  • Pixel clock
  • HSYNC
  • VSYNC
  • Data Enable (DE)

If no valid image data is latched, the display may show a uniform white screen.


  1. The TFT Driver IC Did Not Complete Initialization

During power-on, the driver IC requires time to:

  • Stabilize internal analog voltages
  • Establish gamma reference levels
  • Start internal oscillators
  • Exit standby or sleep mode
  • Initialize internal logic blocks

If the RESET signal is released too early, or if video data transmission begins before initialization is complete, the driver IC may enter an undefined state. In such cases, it may output the default voltage level, resulting in a white screen.

This is the most common cause observed in practical applications.


  1. Pixel Clock Synchronization Failure

If pixel clock synchronization fails, the driver IC cannot correctly latch pixel data. In this case, the display may exhibit:

  • A white screen
  • A fully bright or fully dark screen
  • Corrupted images
  • Flickering
  • Vertical or horizontal stripes
  • Misaligned lines


Conclusion

A white screen is usually not a display hardware failure.

If the panel is powered and the backlight is functioning, the hardware is operational. However, the initialization sequence may have been incomplete, incorrectly ordered, or mistimed.

Therefore, debugging should focus on verifying: Power sequencing, RESET timing, Initialization delay requirements, Valid timing, and video signal transmission.


If you have any questions, please contact our engineering.

author-avatar

About Alex Wang

Orient Display - Technical Engineer

Displays

1U, 2U, 3U LCD Displays

What are 1U, 2U, and 3U?

“U” refers to the height of a server chassis.
1U equals 1.75 inches (approximately 4.45 cm), so 3U equals about 3 × 4.45 cm.

“U” (short for unit) is a unit used to indicate the external dimensions of modular racks. The detailed specifications are defined by the U.S. Electronic Industries Alliance (EIA), an industry standards organization.

The specified dimensions are a width of 48.26 cm (19 inches) and a height in multiples of 4.445 cm. Because the width is 19 inches, racks that meet this standard are often referred to as 19-inch racks. The height is measured in basic units of 4.445 cm.

Specification Height (mm) Common Uses
1U 44.45 mm High-density servers, network equipment
2U 88.9 mm Balanced computing and expansion
3U 133.35 mm Local interaction / more user-friendly display


Common Rack Cabinet Sizes, How Many Servers Can a 42U Rack Hold?

Server dimensions are standardized so that servers can be properly mounted in steel or aluminum racks. Racks have pre-drilled mounting holes that align with the mounting holes on servers, allowing them to be secured with screws. This standardization makes installation easier and ensures that each server occupies the appropriate amount of space.

The standardized dimensions specify a server width of 48.26 cm (19 inches) and a height in multiples of 4.445 cm. Because the width is 19 inches, racks that comply with this standard are often referred to as “19-inch racks.” Height is measured in units of 4.445 cm, where 1U = 4.445 cm. Details are shown in the table below.

  • What Are the Dimensions of a 42U Rack?

A 42U rack cabinet typically measures:

  • Height: 2.0 meters
  • Width: 0.6 meters
  • Depth: 0.8 meters

Some models may also have a depth of 0.96 meters, while maintaining the same height and width.

  • How Many Servers Can a 42U Rack Hold?

The number of servers that can be installed in a rack is limited. A 42U rack does not mean it can hold 42 units of 1U servers in practice. Space must be reserved for:

  • Heat dissipation and airflow
  • Equipment installation and maintenance clearance
  • Power distribution
  • Cable management (top and bottom clearance)
  • Additional equipment such as switches, firewalls, and displays

For example, a standard 42U rack can typically hold up to about 20 servers.

Why 20? Even with 1U servers, space must be left between servers for cooling. In addition, the rack usually needs to accommodate at least one switch, which may require around 2U of space.

If 2U servers are used, the rack can generally accommodate around 10 servers, plus additional networking equipment such as switches and routers.


1U / 2U / 3U Chassis and Display Size Design Recommendations

1) 1U Chassis (Highly Space-Constrained)

Feasible Solutions:

  • 3″ – 2.4″ OLED / LCD
  • Monochrome character displays, dot-matrix modules, or low-resolution color displays

Intended Use Only For:

  • Status information
  • IP address / temperature / alarms
  • Menu navigation

Typical Display Parameters:

  • Screen height: ~30 mm
  • Resolution: 128 × 64 or 320 × 240
  • Aspect ratio: 4:3 or ultra-wide (bar display)

Orient Display offers many monochrome character LCD modules and dot-matrix graphic LCD modules suitable for 1U applications. It also provides a wide selection of small-size color TFT modules. Since most small TFT modules are designed in portrait orientation, they typically need to be rotated 90 degrees for use in 1U systems.

There are also bar displays available on the market that are suitable for 1U applications, such as the 80 × 116 graphic TFT 1U display. In addition, Orient Display offers a 6.9-inch 280 × 1424 capacitive touch display as an option.


2) 2U Chassis (Where It Becomes “Visually Usable”)

This is the starting point for true embedded displays.

Recommended Sizes:

Screen Size Usability
3.5″ Barely interactive
5″ Recommended
7″ Upper limit (requires ultra-thin bezels)

Typical Display Parameters:

  • Available height: ~70 mm
  • Resolution: 800 × 480 or 1024 × 600
  • Aspect ratio: 16:9 or 16:10

Orient Display offers many mid-size color TFT modules suitable for 2U applications, available in both portrait and landscape orientations. For example, 5.0″ 800 × 480 TFT modules are commonly used. In addition, Orient Display also provides 7.8″ 1280 × 400 bar displays with capacitive touch, which are well suited for 2U chassis designs.


3) 3U Chassis (A True “Monitor-Like” Experience)

3U is the most comfortable height for UI designers, offering ample space for layout, typography, and interaction.

Recommended Sizes:

Screen Size User Experience
7″ Safe and reliable
8″ Best balance
10.1″ High-end solution

Typical Display Parameters:

  • Available height: ~115 mm
  • Resolution: 1280 × 800 or 1920 × 1200
  • Aspect ratio: 16:10

Orient Display offers many medium-to-large color TFT modules suitable for 3U applications, available in both portrait and landscape orientations. For example, an 8.0″ IPS TFT (800 × 1280) with all viewing angles, medium brightness, and a MIPI interface is a representative option.


If you have any questions, please contact our engineering.

Displays

Why Does E ink Refresh Slowly?

E-ink or E-paper displays are widely used in e-readers, digital signage and digital art frames.  They offer ultra-low power consumption, and are easily readable in direct sunlight.

Its key features and benefits include:

  • Low Power Consumption
  • Paper-Like Appearance and Eye-Friendly Reading
  • Flexibility and Versatility


However, one of the main primary weaknesses of e-ink displays is its slow refresh rate. Compared to LCD or OLED, e-ink displays normally cannot display videos.

Why does E-ink refresh so slowly? Because E‑ink displays form images by physically moving real micro‑particles suspended in liquid, rather than lighting up pixels with electric current like LCD or OLED panels.


Display Type Light Source Display Mechanism Refresh Speed
LCD Backlight + liquid crystal rotation Molecular orientation change Milliseconds
OLED Self‑emissive Electronic transition Microseconds
E-ink Reflective Physical particle movement 100 ms to seconds


Table 1. Refresh Speed of Different Display Types

Take the simplest black‑and‑white e‑ink display as an example. Its working principle is as follows:

Each pixel contains many microcapsules filled with:

  • Positively charged white particles
  • Negatively charged black particles

https://www.eink.com/


By applying an electric field, white particles are pulled to the top → the pixel appears white; black particles are pulled to the top → the pixel appears black.

The key point is that this is mechanical displacement, not electronic transition. These particles are microns in size and move within a high‑viscosity fluid, so their speed is far slower than electrons moving through a conductor. If the particles move too quickly, they may not settle accurately, causing artifacts or ghosting.

Refreshing an e‑ink display is not a simple on/off action. It involves multiple steps:

  • Clearing the screen
  • Reverse driving
  • Multiple pull‑backs and fine adjustments

Each step requires waiting for the particles to stabilize. This is why you see the screen flash and gradually become clear during a refresh.

E‑ink is designed to be bi‑stable, meaning it can retain an image for long periods without power, with a paper‑like stable appearance. Achieving this requires sacrificing some refresh speed in exchange for ultra‑low power consumption and reduced eye strain.

With ongoing improvements, modern e‑ink displays can increase refresh speed through several optimizations:

  1. Black‑and‑white 1‑bit Mode

Fast‑refresh modes often support only pure black and white, removing the complexity of 16‑level grayscale calculations. The image is simplified to 1‑bit data, enabling extremely fast processing.

  1. Partial Refresh / A2 Mode

A full refresh cycles through black‑white‑black transitions to eliminate ghosting. Fast modes update only the pixels that change, without forcing a full‑screen wipe, greatly reducing update time.

  1. Dithering Algorithms

Techniques like Floyd–Steinberg dithering simulate gray levels using patterns of black and white pixels. This preserves acceptable image quality while maximizing refresh speed.

These techniques improve speed, but image quality decreases and ghosting accumulate more quickly.


Why Is Color E‑Ink Even Slower?

Because color e‑ink adds additional layers of complexity on top of an already slow black‑and‑white system. Each color technology introduces extra steps that slow down refresh.

Current mainstream color e‑ink technologies (Kaleido, Gallery) do not emit RGB light directly. Instead, they rely on layered structures or multi‑particle systems.

A. Color Filter Array (Kaleido)

This is the most common color e‑ink today.

https://www.eink.com/


Each color pixel is composed of multiple black‑and‑white sub‑pixels. A single-color pixel contains 3–4 monochrome sub‑pixels, and color depth is controlled by adjusting the black/white ratio. Changing a color cannot be achieved in a single drive cycle. To achieve fine grayscale control, multiple waveform adjustments are required, which increases refresh time.

Because this technology still relies on black‑and‑white particle movement, it can approach the speed of monochrome e‑ink, but color saturation is limited.


B. Multi‑Color Particles (Gallery / ACeP)

This is true full‑color e‑ink.

https://www.eink.com/


Each microcapsule contains four types of charged color particles (yellow, cyan, magenta, reflective white). Compared with controlling two particle types in monochrome e‑ink, this system must control four, greatly increasing complexity.

To display a specific color, each particle type must be positioned at the correct height. During refresh, the system must use extremely complex voltage waveforms to guide specific particles through a crowded mixture and bring them to the top. It’s like trying to push only the people wearing blue shirts to the front of a packed crowd—much harder than having everyone move together.

Particles collide and rub against each other during movement, and the internal electric field becomes more chaotic as particle types increase. To ensure accurate color without ghosting, the system must “shake” the particles repeatedly to settle them properly. This is why color e‑ink often flashes many times during refresh. A single refresh may require dozens or even hundreds of waveform cycles, taking several seconds or even more than ten seconds.

This technology produces vivid, saturated colors, but is too slow for interactive use.

Additionally, e‑ink is extremely temperature‑sensitive. At low temperatures, the liquid becomes more viscous, slowing particle movement further and requiring more complex compensation algorithms.


How Color E‑Ink Refresh Speed Can Be Improved

Current optimization efforts focus on hardware, software, and algorithmic improvements:

  1. Hardware: Dedicated Display Memory and GPU

Traditional e‑readers rely on the CPU for image processing, but color e‑ink waveform control is too complex. Some manufacturers add a dedicated display processor to handle image conversion and waveform generation, reducing CPU load and improving refresh speed.

  1. Software: Dynamic Refresh Modes

Manufacturers offer preset modes such as Fast or A2 Mode. These reduce color depth and resolution (using dithering) to increase speed. Page turns become very fast, and even cursor movement becomes visible, but noise and ghosting increase.

  1. Algorithms: Waveform Optimization

Shortening voltage pulses allows particles to stop before reaching their “final” position, enabling quicker transitions.


Conclusion

Given current technology, e‑ink’s core strengths remain long‑term static display, low power consumption, and high readability. It cannot yet match TFT‑based displays in color vibrancy or interactive speed.


Should you have any questions, please consult our engineering.

Shop our E-Ink Display here: https://orientdisplay.com/e-paper/

author-avatar

About Hannah Lu

Orient Display - Sales Manager

Displays

Understanding the Relationship Between Touch IC Driver, Firmware, and Configuration

When working with a Capacitive Touch Panel (CTP) software engineering team, we often refer to the terms Driver, Firmware (FW), and Configuration. These three concepts are not only discussed during the design phase, but are also repeatedly involved in later stages such as testing and validation.
Understanding the relationship and differences between them is fundamental to carrying out our related work effectively.

Recently, one of my customer asked: is it possible that different Touch ICs can use a same driver. Well, as an engineer, I fully understand the reason behind this question. If we can use one driver on different touch ICs, it will greatly reduce the development effort, maintenance cost and overall system complexity.

This article may be helpful for you to understand the relationship between driver, firmware and configuration, and answer the question above.

  1. Driver

A driver is a host-side software that enables on the operating system (for example, Linux / Android / RTOS) or main controller to communicate with a hardware device. In a touch system, the driver is responsible for handing the communication protocol (such as I2C or SPI), reading and writing registers, parsing touch data, and reporting touch events to the system. The driver is a bridge between the host and the hardware, here, is the touch.


  1. Firmware (FW)

Firmware (FW) is the software that run on the internal MCU of the touch IC and controls its core functions and behavior. In a touch system, the firmware determines how the touch IC works want what data it output. It can capture the touch signals, execute touch algorithms, manages TX/RX channels, and defines the data format.

Here, you may notice the most significant difference between driver and firmware. Driver always works on the host MCU, it is on the host side; while firmware runs on the touch IC. In a word, the driver helps the host to understand and receive the touch date, it is the “translator” between the MCU and the touch IC. While, firmware is the “brain” of the touch IC, it tells the IC what to do and how to do.


  1. Configuration (Parameter Settings)

Different from driver and firmware, configuration itself is not a software, it is a set of parameters used to adjust how a touch IC operates, it provides the numerical and structural parameters that the firmware uses during operation. As a result, the same touch IC and firmware can work with different touch panels without modifying the touch algorithms*.

*What is algorithm logic? In one sentence summary, the algorithm logic are the firmware logic that converts the raw capacitive signals into accurate and reliable touch events. The algorithm logic determine whether a touch detected, where it is located, how many touch points are present.

*Here we can take a example to help you understand what a algorithm logic dose. Touch technology is widely used in kitchen appliances. For example, water droplets on an oven control panel can produce capacitive signals similar to a finger touch. The ability to tell water apart from a real finger touch depends on the touch algorithms.

Configuration is not code and does not contain any algorithm logic. It is stored in Flash of the touch IC, EEPROM, or sometimes it maybe also stored in the firmware. When the system turns on or initialization starts, firmware will read these parameters, and operate the touch algorithms based on these parameters. For example, there are two touch panels with different sizes and sensor patterns, however, we can use the same touch IC and firmware, this is achieved by setting up different configurations.


Now, let’s go back to our customer’s question: is it possible that different Touch ICs can use a same driver? The answer is yes. This is because a driver primarily depends on the communication protocol and data format. Do you remember, we have explain that the driver is the “translator” between the MCU and the driver IC. Same communication protocol and data format means they speak the same language. However, if the communication protocol is different, let’s say SPI and I2C, in this case, you will need two drivers. Normally, as long as the communication protocol and data format are consistent and the ICs belongs to the same series, the driver can be shared.

Should you have any questions, please consult our engineering.

author-avatar

About Alex Wang

Orient Display - Technical Engineer

Displays

The Future of Display Technology: What Comes After OLED?

From smartphones and smartwatches to TVs, cars, and AR glasses, displays have become the primary interface between humans and technology. While OLED has dominated premium displays for the past decade, the industry is already looking beyond it. New technologies promise higher brightness, longer lifetimes, lower power consumption, and entirely new form factors—but each comes with trade-offs.

So, what does the future of display technology really look like?

Why OLED Isn’t the Final Answer

OLED revolutionized displays with deep blacks, thin panels, and vibrant colors. But it has limitations:

  • Organic materials degrade over time

  • Burn-in remains a concern

  • Peak brightness is limited compared to inorganic solutions

  • Manufacturing costs are high for large or specialty panels

These challenges are driving massive investment into next-generation alternatives.

By Matthew Rollings at English Wikipedia, CC BY 3.0, https://commons.wikimedia.org/w/index.php?curid=14914205

Mini-LED: The Practical Middle Ground

While Micro-LED grabs headlines, Mini-LED is quietly improving today’s LCDs. Instead of hundreds of standard LEDs, Mini-LED displays use thousands of much smaller LEDs arranged behind the panel. These LEDs are grouped into local dimming zones, allowing precise brightness control across the screen.

Mini-LED technology:

  • Uses thousands of tiny LEDs for local dimming

  • Achieves very high brightness

  • Improves contrast dramatically over traditional LCDs

  • Leverages existing manufacturing infrastructure

They may not offer “perfect black” like OLED, but they provide a cost-effective path to premium performance—especially for TVs and monitors.

Micro-LED: The “Ultimate” Display—At a Cost

Micro-LED is often described as the holy grail of display technology.

Each pixel is a tiny inorganic LED, meaning:

  • No backlight is required
  • Brightness can exceed 4,000–5,000 nits
  • Lifetimes exceed 10,000 hours
  • No burn-in risk
  • Exceptional contrast and outdoor readability

This makes Micro-LED ideal for wearables, premium TVs, and high-brightness applications.

The Problem?

Manufacturing.

Micro-LED requires:

  • Precise placement of millions of microscopic LEDs
  • New fab lines
  • Low yields (for now)
  • Extremely high cost

In real-world products, Micro-LED displays can add hundreds of dollars compared to OLED. For now, Micro-LED is a technology showcase, not a mass-market solution.

https://ph.garmin.com/products/wearables/fenix-8-microled/

Quantum Dots: The Silent Game-Changer

Quantum dots (QDs) are already everywhere—their role is expanding. Quantum Dot (QD) technology is a display enhancement method that uses nanometer-scale semiconductor crystals to produce extremely pure and accurate colors. When exposed to light or electricity, quantum dots emit very precise wavelengths of red, green, or blue — resulting in brighter images, richer colors, and higher efficiency than traditional display materials. Quantum dots are incredibly small— thousands of times thinner than a human hair. Their size determines the color they emit:

  • Smaller dots → Blue light
  • Medium dots → Green light
  • Larger dots → Red light

Lee J H. QD Display: A Game‐Changing Technology for the Display Industry[J]. Information Display, 2020, 36(6): 9-13.

Today

  • Used in QD-LCD and QD-OLED to improve color purity and brightness

Tomorrow

  • Electroluminescent Quantum Dots (QDEL / EL-QD / NanoLED) could become fully self-emissive displays
  • Similar benefits to OLED, but with:
    • Higher brightness
    • Better stability
    • Potentially lower cost

The Catch

Many high-performance quantum dots rely on cadmium, a hazardous material. The race is on to develop cadmium-free alternatives that maintain the same performance.

If successful, quantum-dot displays could leapfrog Micro-LED by using existing fab lines instead of building entirely new ones.

Why Manufacturing Matters More Than Technology

In display history, the “best” technology doesn’t always win.

What matters most:

  • Yield
  • Cost per panel
  • Scalability
  • Supply chain readiness

This is why:

  • LCD survived for decades
  • OLED took years to mature
  • Micro-LED may take longer than expected

The future belongs to technologies that balance performance and manufacturability, not just lab results.

What the Next 10 Years May Look Like

Rather than one winner, expect multiple display technologies to coexist:

  • Short term (now–2028)
    OLED, Mini-LED, QD-OLED dominate consumer products
  • Mid term (2028–2032)
    Early Micro-LED and QDEL adoption in wearables, automotive, and premium devices
  • Long term (2030+)
    New emissive technologies enable AR glasses, ultra-bright outdoor displays, and ultra-thin form factors

Final Thoughts

The future of display technology isn’t just brighter or sharper—it’s about efficiency, durability, and enabling new experiences. Whether Micro-LED becomes mainstream or quantum dots take the lead, one thing is clear:

The display is no longer just a screen—it’s the product, a brand differentiator.

Companies that invest in the right display technology today will define:

  • How products look
  • How long they last
  • How users experience them

The future of display technology is brighter, smarter, and closer than you think.

Should you have any questions, please consult our engineering.

author-avatar

About Daini Sun

Orient Display - Engineer